Quality of Life on Maui
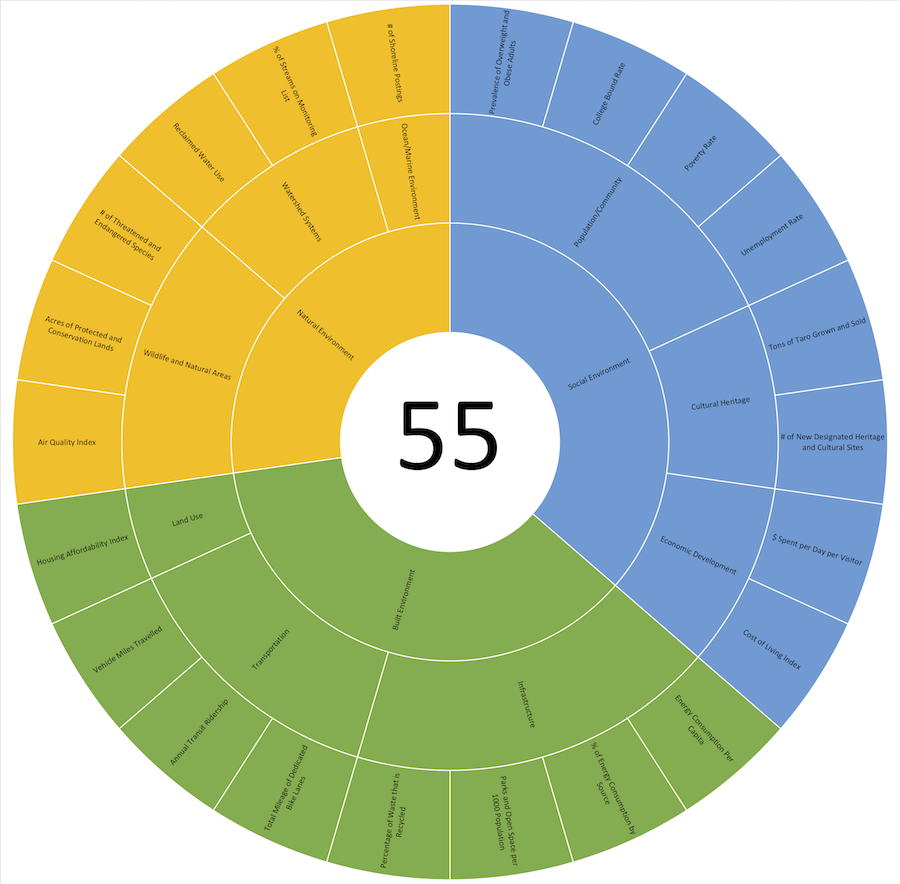 In the 2012 Maui Island Plan, the Planning Department identified, and committed to track, 36 quality of life indicators that could be tracked to monitor progress towards achieving the goals of the Plan:
| BUILT ENVIRONMENT INDICATORS |
| LAND USE |
| 1. Building Permits issued inside UGB vs. outside UGB |
| 2. Average Density of new developments |
| 3. % of Infill vs. Greenfield development |
| 4. Housing affordability Index |
| TRANSPORTATION |
| 5. Vehicle Miles Travelled (VMT) |
| 6. Commute Mode Shares |
| 7. Annual Transit Ridership |
| 8. Total Mileage of dedicated bike lanes |
| INFRASTRUCTURE |
| 9. Percentage of waste that is recycled |
| 10. Parks and Open Space per 1000/population |
| 11. % of energy consumption by source of production |
| 12. Energy consumption per capita |
| SOCIAL ENVIRONMENT INDICATORS |
| ECONOMIC DEVELOPMENT |
| 13. Cost of Living Index |
| 14. Value of Agricultural Production |
| 15. $ spent per day per visitor |
| 16. % of Fruit and Vegetables consumed that are grown on Maui |
| POPULATION/COMMUNITY |
| 17. Unemployment rate |
| 18. Poverty rate |
| 19. College bound rate |
| 20. Prevalence of overweight and obese adults |
| CULTURAL HERITAGE |
| 21. Course enrollment in Hawaiian Language programs |
| 22. Tons of Taro grown and sold |
| 23. # of new designated heritage and cultural sites |
| 24. Scenic Roadways – total miles |
| NATURAL ENVIRONMENT INDICATORS |
| WATERSHED SYSTEMS |
| 25. % of streams of monitoring list |
| 26. Reclaimed water use |
| 27. Watershed health |
| 28. Drinking water quality |
| OCEAN/MARINE ENVIRONMENT |
| 29. Coastal water quality |
| 30. % of healthy coral reefs |
| 31. # of shoreline postings (beach closures due to pollution) |
| 32. Amount of reef fish biomass |
| WILDLIFE AND NATURAL AREAS |
| 33. # of threatened and endangered species |
| 34. Acres of protected and conservation lands |
| 35. Air Quality Index |
| 36. Habitat fragmentation |
Source: Maui Island Plan, Chapter 9: Monitoring and Evaluation. https://www.mauicounty.gov/DocumentCenter/View/84673/Chapter-9?bidId=.
Indicators that have been struck from the table were not included in our Quality of Life assessment because either there is no public data on the indicator or the indicator is too complicated to quantify for the purposes of this assessment.
For the other indicators, we located public facing data from the data sources indicated in the Maui Island Plan. Where possible, Maui specific data was compared to national averages. For indicators that could be compared to national averages, the national average was assigned a score of 50. The Maui Quality of Life Score for that indicator was determined by calculating the percentage difference between the national average and the Maui specific data. For indicators where there is no national average, or the indicator is too complicated or subjective to be systematically assigned a numerical score, the indicator was assigned a neutral score of 50.